What KV Analytics can do
See below for what our advanced analytics system can provide you.
See below for what our advanced analytics system can provide you.
Today Kings View Information Technology provides electronic health record system, billing, implementation, and State reporting support to 24 CA counties as well as agencies in Minnesota and Virginia. Health Information Analytics division provides services to 9 CA counties.
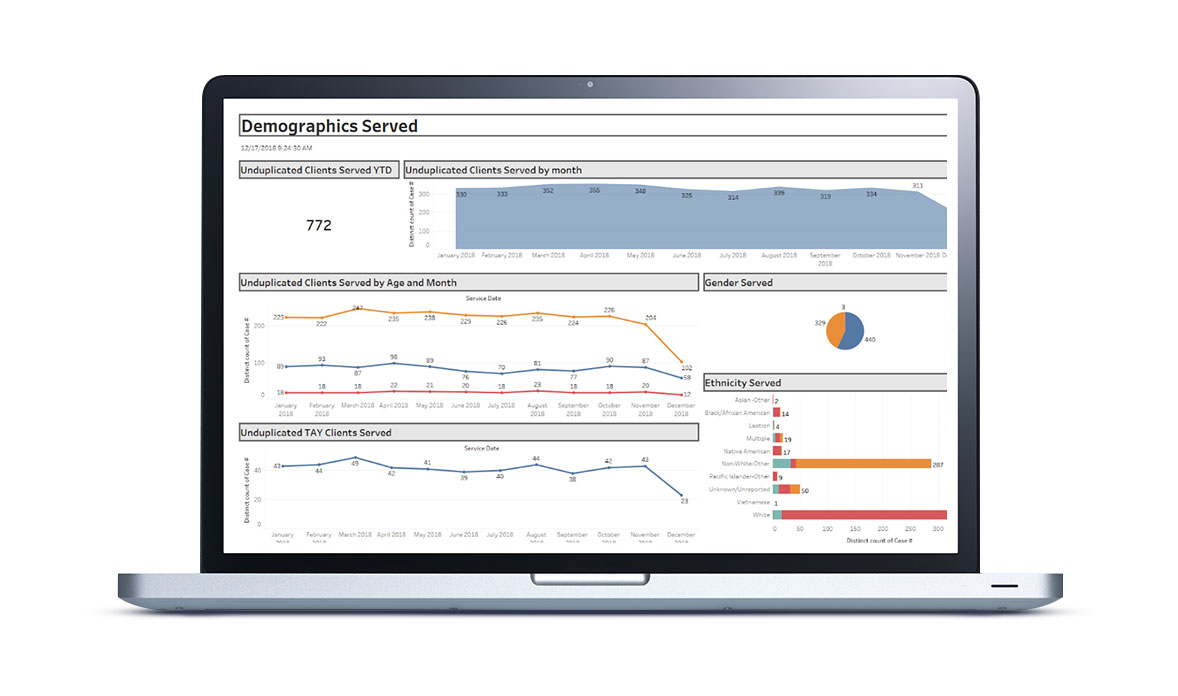
View the demographics of the clients you serve and gain a greater understanding of your impact upon the community.
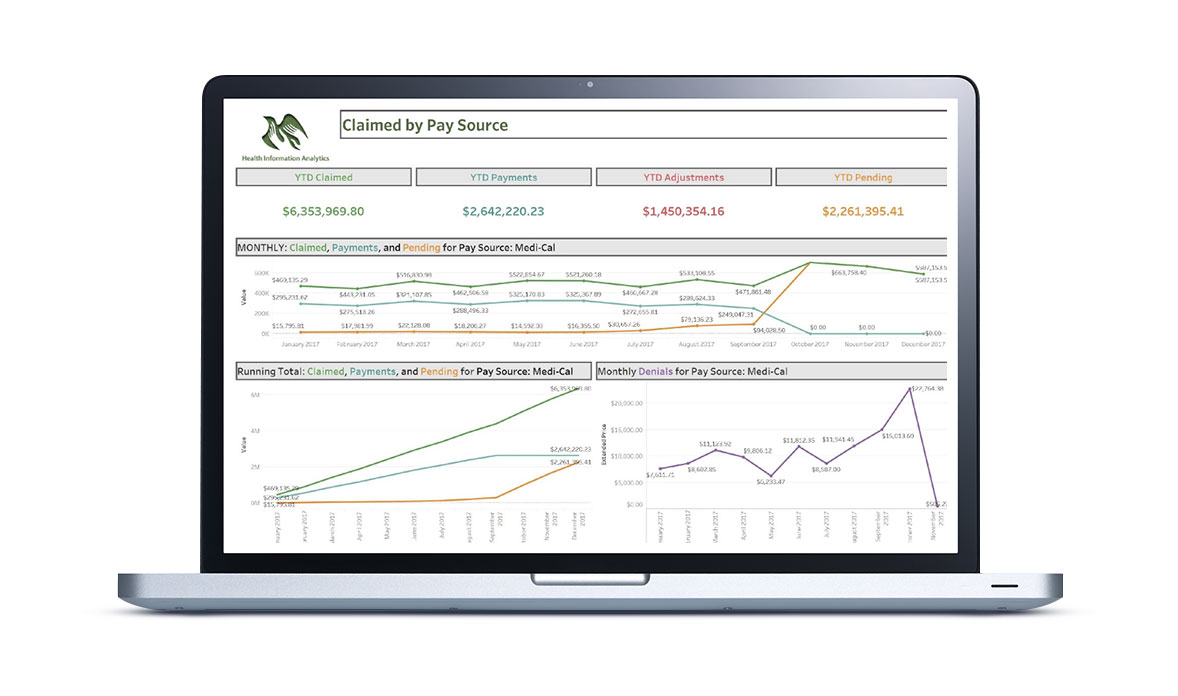
Track your organization’s billing processes and quickly see what pay sources you’re billing, how much has been claimed, and what is left outstanding. Drill down into the details to see services that were denied and high utilizers of your organization’s services.
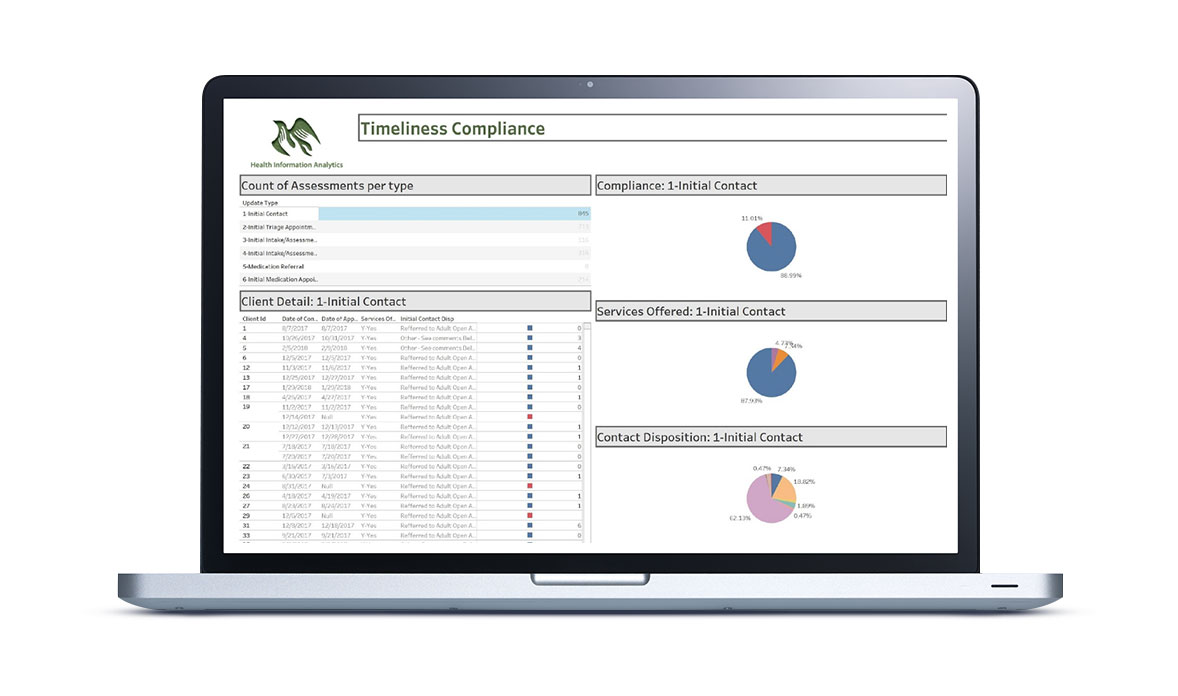
The time between a client’s first contact to their first service can be vital to ensuring proper client engagement and successful clinical outcomes. Understand how your organization is performing using dashboard views that not only give an overall summary of your organization’s performance in this area, but also provides details on individual client contacts and their outcomes.
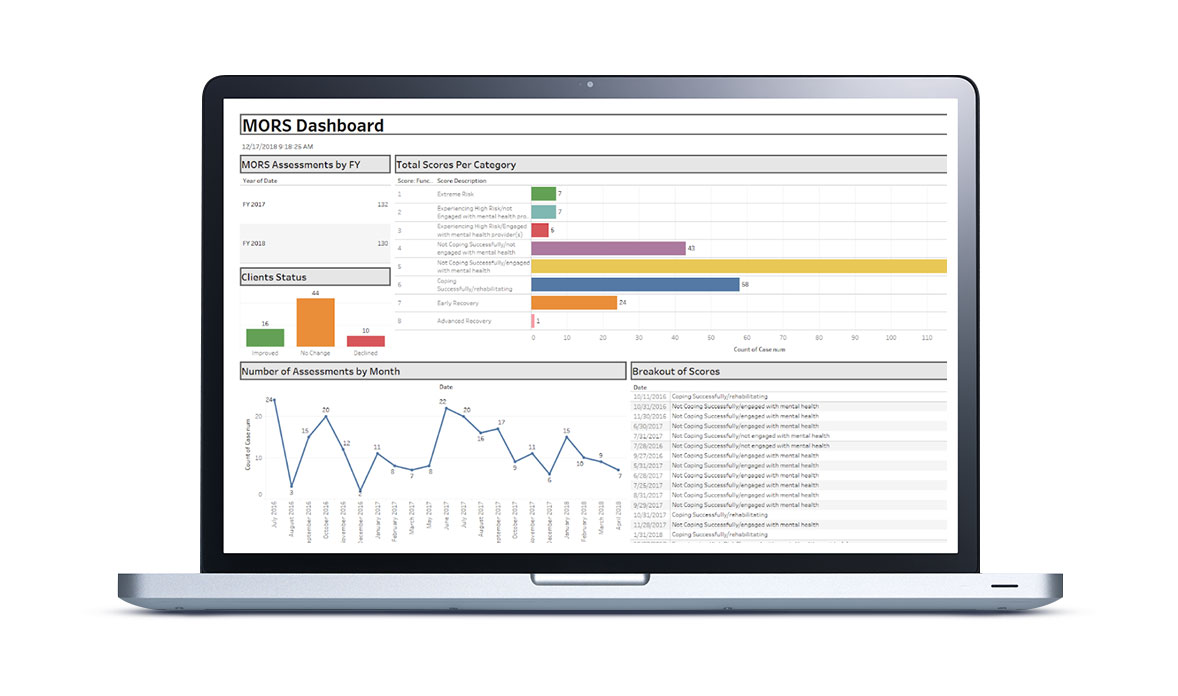
Evaluate how effective your clinical services are upon client outcomes. Track a client’s progress through your programs from initial contact through discharge and understand the factors that may influence your clients’ path to wellness and recovery.
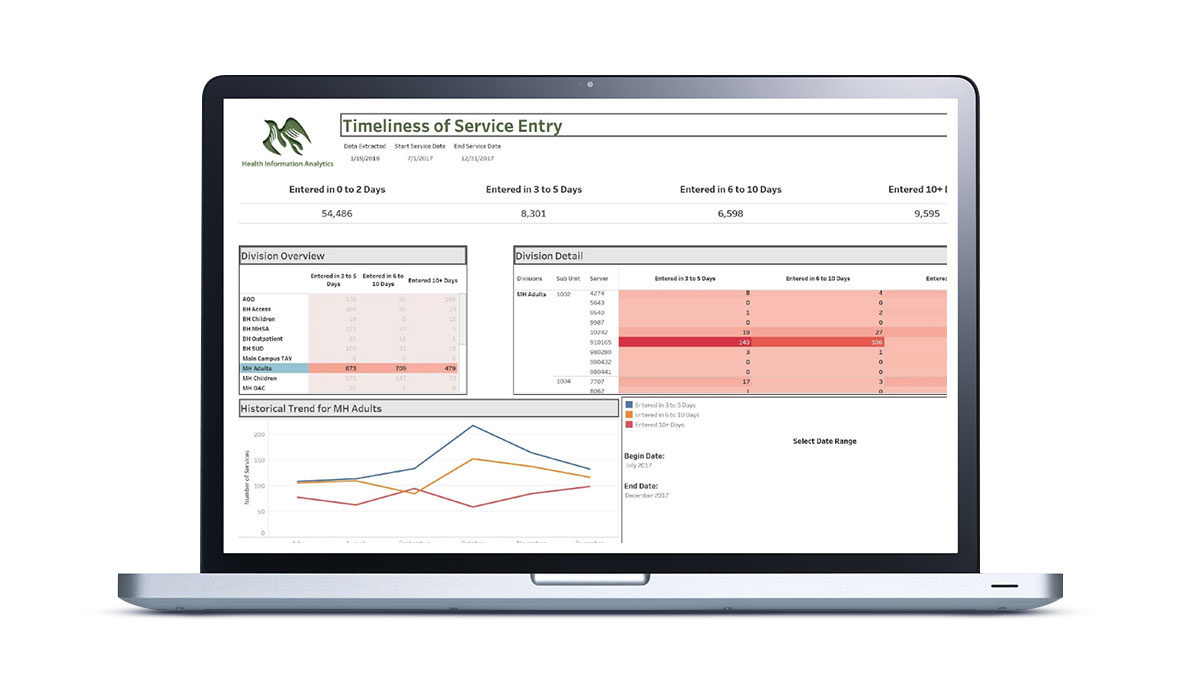
Keep up to date with how quickly clinical documentation is being entered into your business systems and identify any potential problems with chart integrity. In moments you can see how your entire organization or even individual staff members are doing in this vital area.
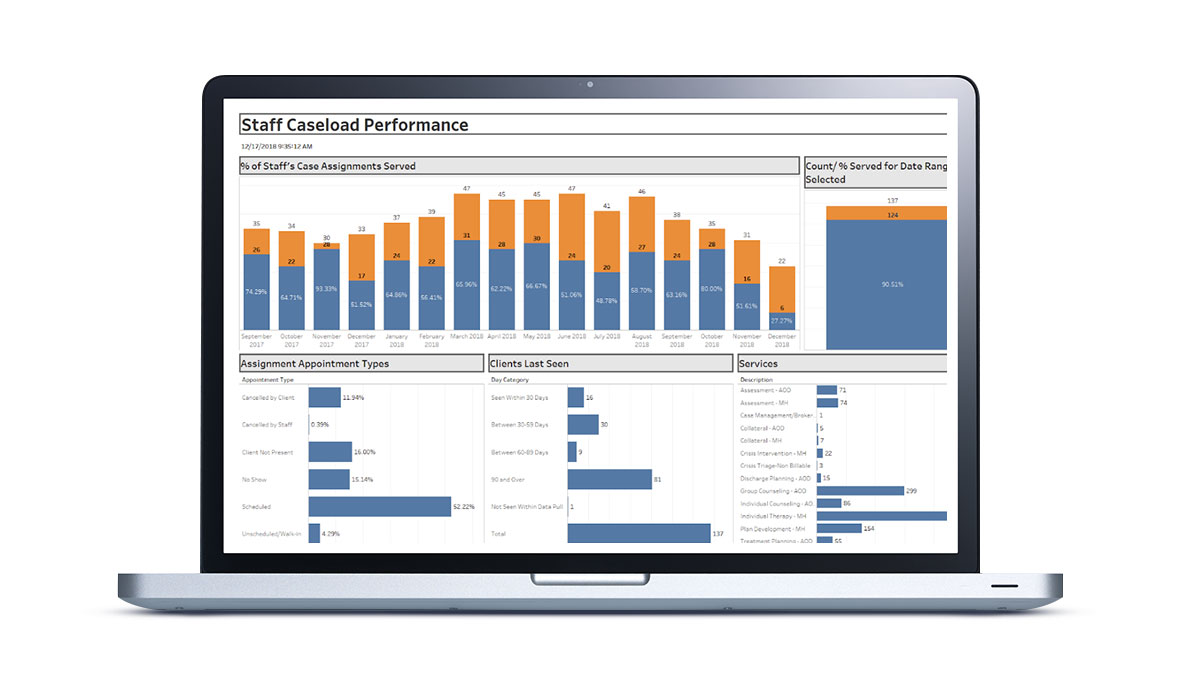
Evaluate the effectiveness of your caseload management process using the power of your data. See if your clients are being seen regularly, identify clients in need of re-engagement, and understand the impact of your staff’s caseload size upon service delivery.
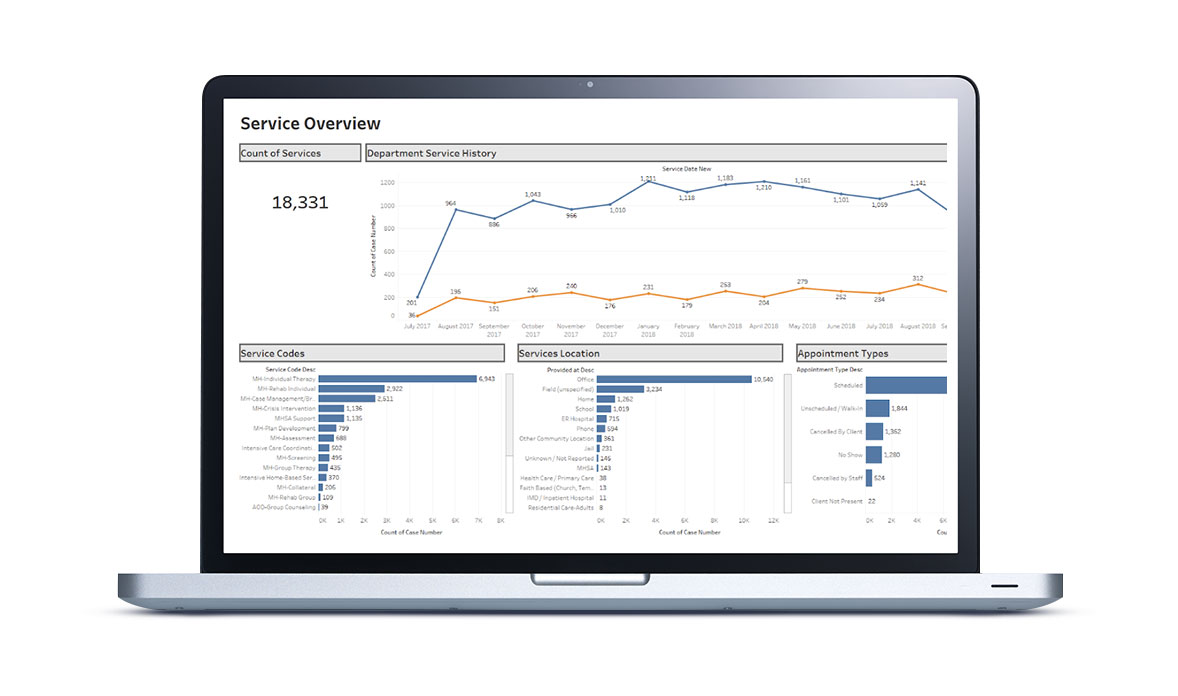
Fully understand the services your organization is providing with views that show the types of services being provided, how many, and the location these services are being provided at. See how many services are being cancelled by your clients and track no show patterns over time. Use the power of this information to ensure that the right resources are available where they’re needed the most.
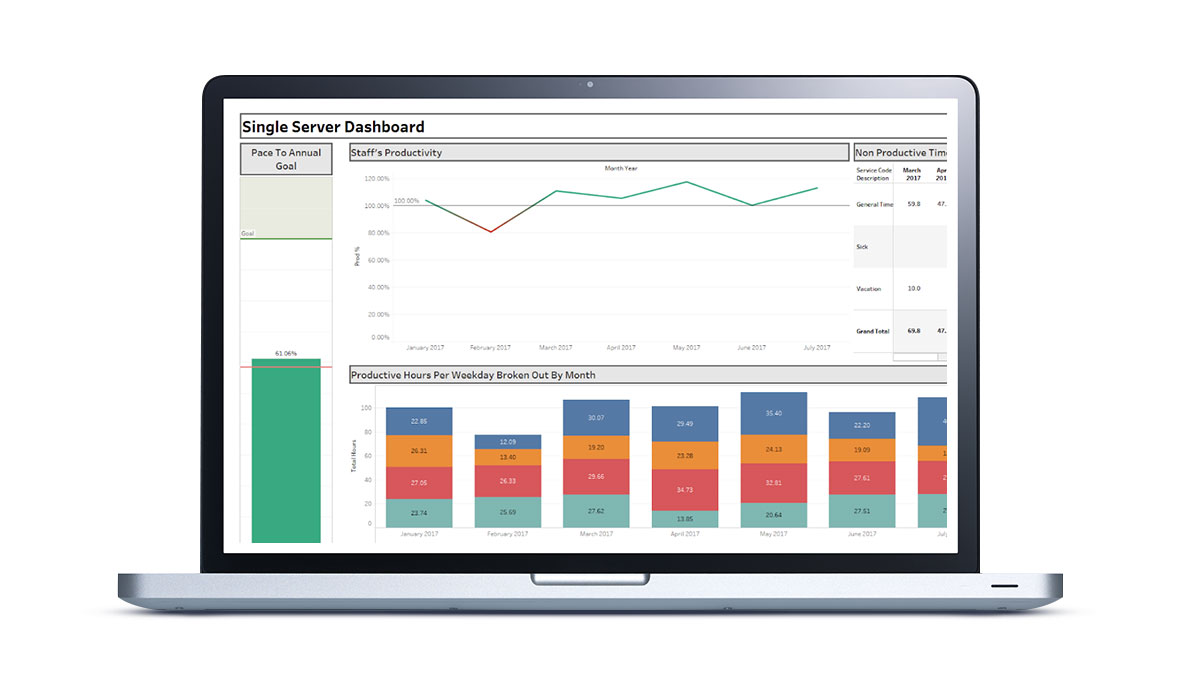
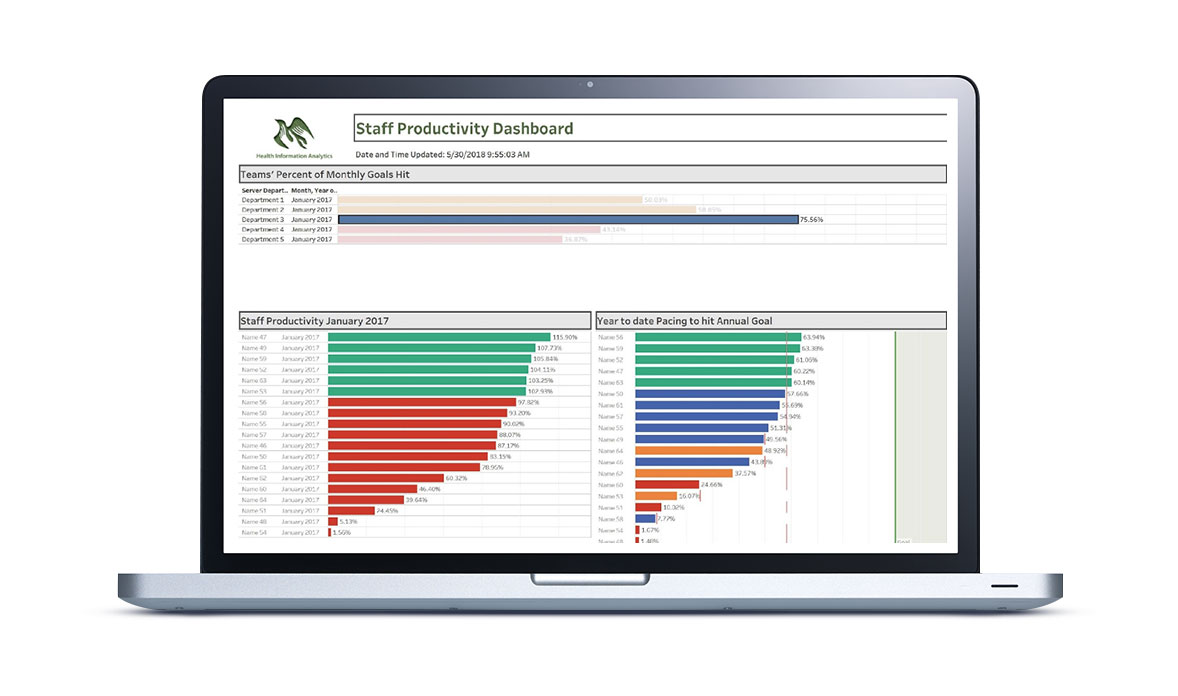
At a glance see how your department, programs, and teams are performing. Historical trends, key performance indicators, and progress towards goals can be visualized and easily understood. Even the performance of individual staff members can be viewed with the click of a mouse. Let data drive your productivity and watch your revenue grow!